


After performing content marketing campaigns, you will have a treasure trove of blog posts, social content, videos, and more.
But it needs to be organized. Otherwise, you don’t what is working, what isn’t, and what the next best action is.
In fact, 63% of businesses don’t have a well-documented content strategy. This can create confusion, disorganization, a poor marketing performance.
That’s where a content audit comes in the picture.
Some businesses perform one every quarter or year. Choose a schedule that works best for you.
Auditing your content will help shape future content strategies, find profitable opportunities, and fix weaknesses.
In this post, we are going to teach you a five-step content audit you can follow.
Collect all of your content data
The first step in a content audit is to collect and organize your content data. This will allow you to audit different metrics in the later steps.
We suggest downloading the free version of the technical tool Screaming Frog. There is also a premium annual license you can purchase for extra features and limits.
Screaming Frog is a crawling tool that will collect data from your website including URLs, meta descriptions, title tags, word count, and more. It’s a staple software in the SEO and content marketing community.
Enter your URL at the top of the tool and press “Start.”
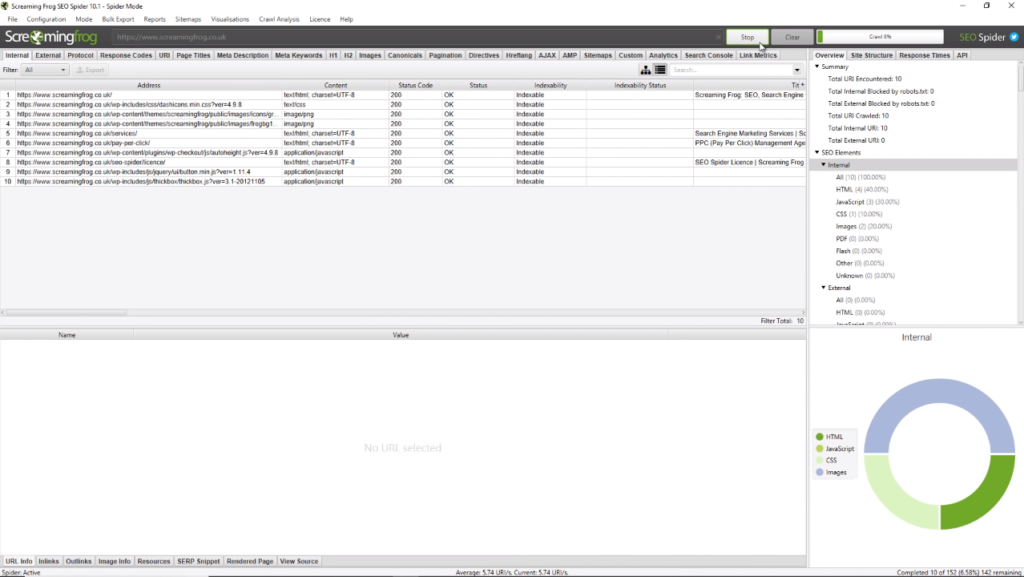
This will crawl your website and create a list like this:
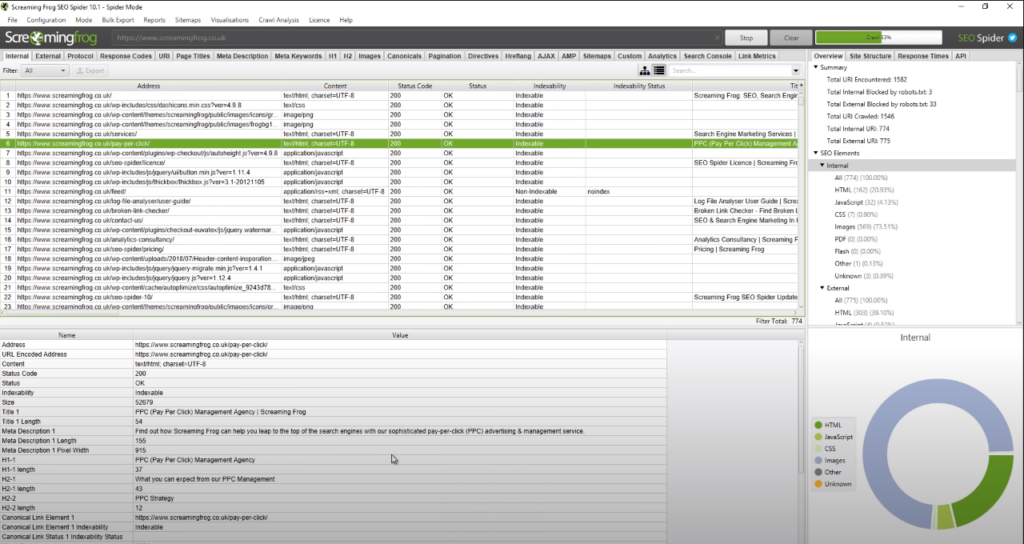 Filter by HTML via the top left dropdown as we are primarily interested in auditing the pages of our website, not images, CSS, JS, etc. Click the “Export” button next to this afterward.
That brings us to the next step.
Retrieve and analyze key metrics
Content marketing success stems from having clear key performance indicators and measuring them. These are metrics that act as a north star. You can observe them to determine if you’re on track.
Here are some metrics you should audit. We will be showing you with Google Analytics.
Average time on page
The average time users spend on a single page or across your website is a testament to its quality and relevance.
The higher the average time, the better. Some niches like weather and news sites may have lower average session duration because the users are getting quick information and leaving.
However, for most sites, you will want to aim for two to three minutes.
Navigate to “All Pages” under “Behaviour” and you’ll see your average time on page.
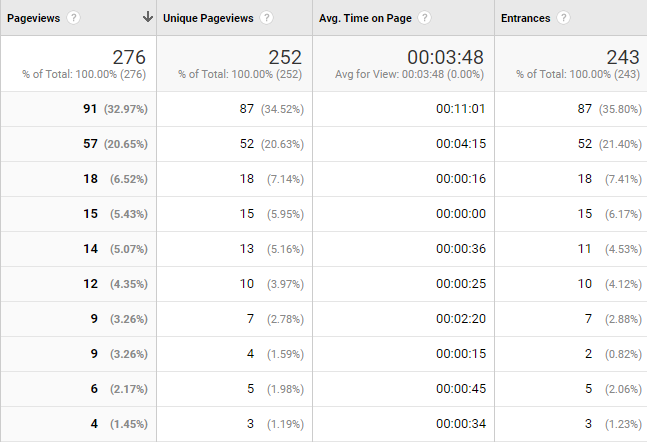
Export this data via the top right of Google Analytics.
Bounce rate
The bounce rate is the number of users who visit your website and leave without visiting other pages. A high bounce rate can be a signal to Google that your content isn’t high quality or relevant, hurting rankings.
The average bounce rate for a website is between 56-70%.
It can be found in the same location as the average session duration.
High bounce rates can be fixed by first adding more internal links to other pages. This will push users deeper into your website.
Secondly, consider updating your hosting or using page speed plugins for a faster website. Use Google’s PageSpeed Insights to determine if there are any speed issues.
Traffic per month
While traffic can be a vanity metric, it is a direct indicator of your content strategy’s success. More traffic means that content, SEO, and other strategies are contributing to an overall traffic increase.
You can view your traffic via Google Analytics by going to the “Acquisition” tab and “All Traffic”
Here you will see all of your traffic sources including organic, email, referral, social, direct, and more.
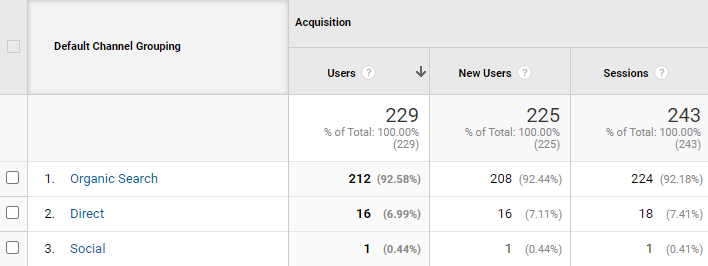 Use this data to determine what sources contribute the most traffic to your website so you can focus on those in the future and dial back those not moving the needle.
Title tags and meta descriptions
Metadata plays a role in both search engine optimization and user experience. Optimizing these pieces of information helps users and search engine spiders better understand the content on a page.
You can access title tags and meta descriptions via your Screaming Frog crawl.
Improving these also increase the click-through rate of your search engine listing, boosting traffic.
Conversions
What’s one of the main purposes of content marketing? To drive conversions! However, conversions can mean many things.
A conversion for one business could be SaaS trials and newsletter signups for another.
Visit the Google Analytics admin panel and create a goal from the far right tab with the correct asset selected.
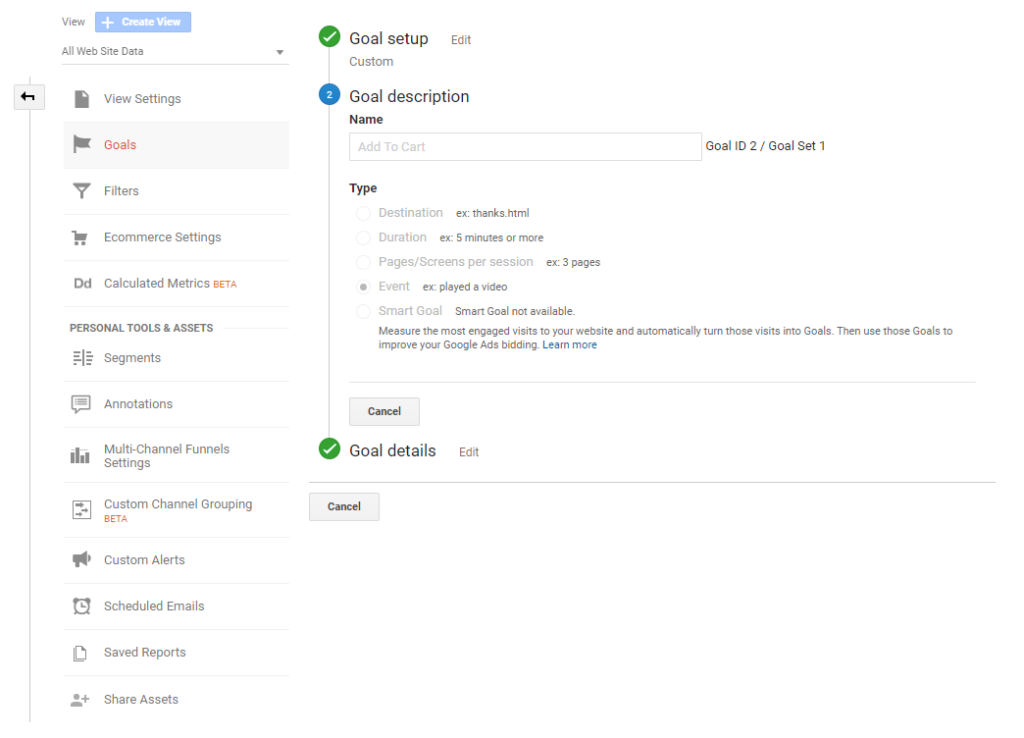 Use the setup wizard and templates to set up a goal for actions like:
- Adding to cart
- Reaching check out
- Purchasing a product
- Using a contact form
- Signing up for a newsletter
- Trying a free demo
- Etc.
You will then be able to see the conversion rate for any goal on various reports on Google Analytics.
Get your backlink profile
SEO and content go hand in hand. One of the greatest components of a good SEO strategy is building relevant and high-quality links.
You can view your backlink profile by using a free tool like Ubersuggest. Enter your domain name to begin.

Click the “Backlinks” section.
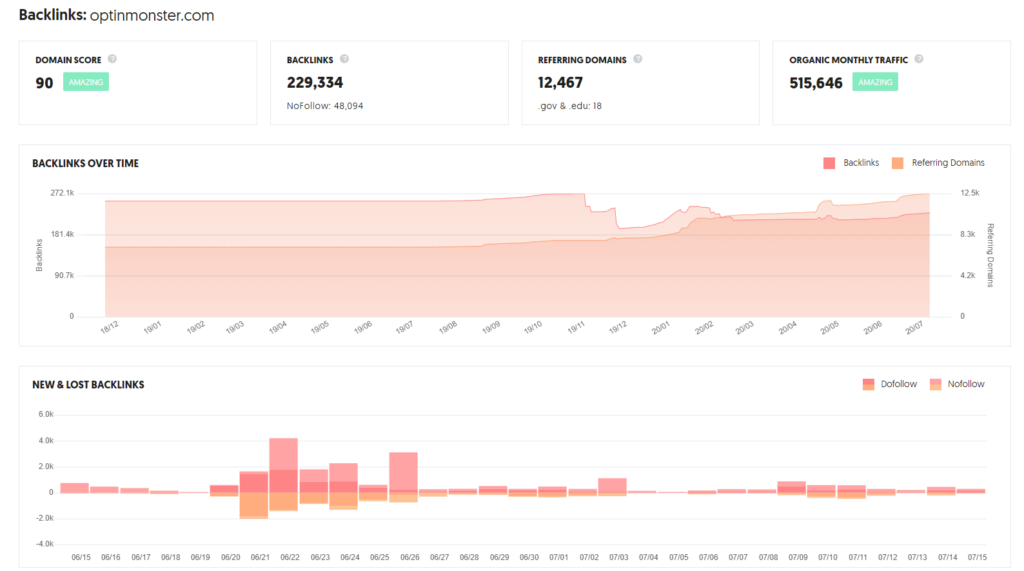
Here you will see the latest and best links your website or the individual page has received.
Use this to determine if your backlinking efforts are working, boosting rankings, and worth continuing or changing.
Look at your social shares
Social sharing is a simple way to understand if your content is being engaged with.
It can also create a viral effect in which people share content they enjoy and others do the same.
Use SharedCount.com to determine how many social shares the top pages on your website have received.
Enter in a URL from Screaming Frog or Google Analytics and click enter.
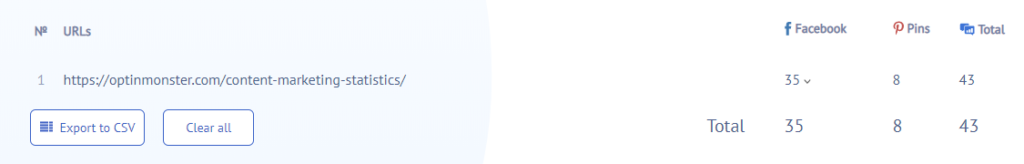
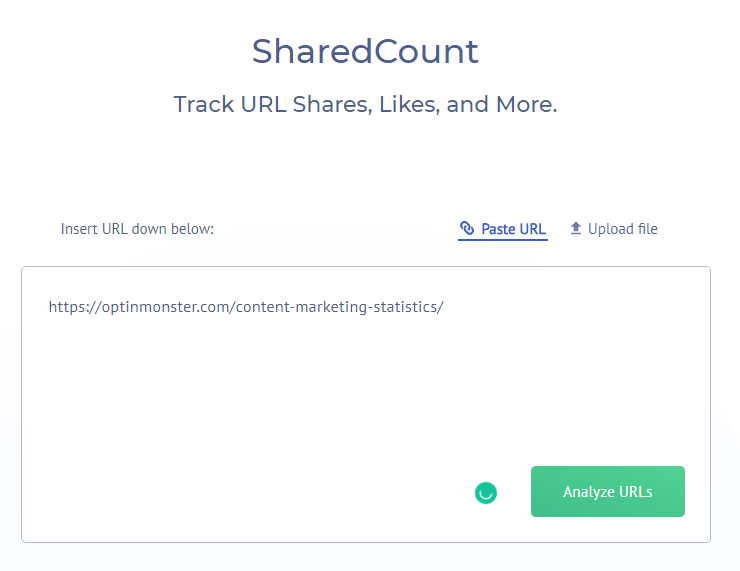 This will display how many shares the URL received on various networks.
 We suggest using a free plugin if you’re on WordPress to add social sharing buttons.
Create an action plan
With all of the data and analytics in the palm of your hands, you might think, “Now what?”
It’s time to begin auditing your content and creating an action plan to improve content marketing performance.
Create a spreadsheet and important your Screaming Frog data. Make a new column labelled “Action” and give it one of the following values:
- Leave
- Improve
- Delete
- Merge
Content that is driving traffic and conversions should be left alone. If it is old, you may one to consider improving it to keep it modern.
Any content lagging behind and not improving KPIs should be improved. Increase the word count, restructure it, add more visuals, and get inspiration from the SERPs for its target keyword.
Content that is contributing little to no value and potentially hurting your branding and marketing should be deleted.
Lastly, any content that is duplicate or covers the exact same content can be merged by combining the content and using a 301 redirect.
Conclusion
It’s not enough to simply do content marketing.
Successful marketers know that they must occasionally audit their strategy to succeed in the long term.
Begin by collecting all of your content data through Screaming Frog and Google Analytics.
Audit key metrics like bounce rate, average time on page, traffic levels, and conversions. Improve any pages that are not meeting your standards.
Use an SEO suite like Ubersuggest, Ahrefs, or SEMrush to analyze your backlink profile. Where are you getting links from? Did previous link campaigns work? Is authority increasing? These are questions you should be asking.
Measure which pages generate the most social shares and mimic the structure to increase how many you receive in the future. Use a social sharing plugin to make this easier.
Lastly, import data in a single spreadsheet and make an action plan. Label which content should be left alone, updated, merged, or deleted. Rinse and repeat every quarter or however often you deem fit!


